Level Of Detail (LOD) Expressions
1. What Is LOD?
When you build a chart, the numbers are computed at the level your chart is grouped by. If your X-axis is Category, you see one sales total per category.
LOD (Level of Detail) lets you compute a number at a different grouping level and bring it into your chart — without changing the chart's grouping.
🎯 Example: "I want total sales by category — but also each category's share of the grand total, a single number computed across ALL data." That grand total is a different "level of detail." LOD makes it possible.
1.1 How to Create LOD (Level of Detail) Formulas
Steps to Create:
- Open Visualizer and navigate to the column bar at the top of the visualizer.
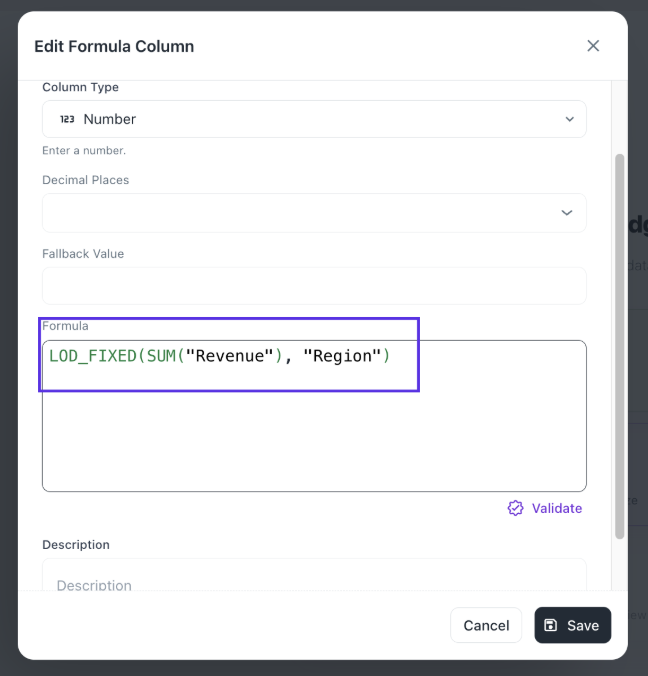
- Click "Create Formula" to open the formula editor.
- Give your new column a name.
- Enter your LOD formula in the editor. For example:
LOD_FIXED(SUM("Revenue"), "Region")
- Click Save to create the calculated column.
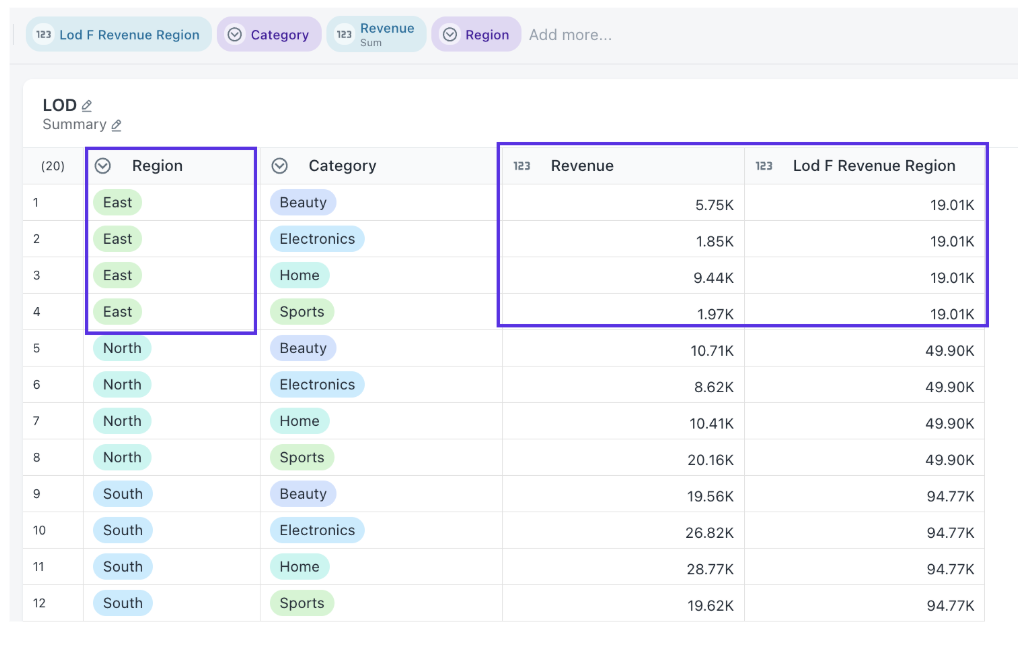
- The new column will appear alongside your other columns and can be dragged into any widget configuration.
Once created, the LOD column will behave like any other column in your dataset. You can use it along with any dimension in charts, the computed value stays fixed at the level you defined, regardless of how the visualization is grouped.
2. The Three LOD Types
| LOD Type | What It Does | When to Use |
|---|---|---|
| LOD_FIXED | Compute at exactly these dimensions — ignores chart grouping | Grand totals, per-customer totals, fixed benchmarks |
| LOD_INCLUDE | Add extra dimensions to the chart grouping (finer detail) | Per-customer averages shown at category level |
| LOD_EXCLUDE | Remove a dimension from the chart grouping (coarser detail) | Yearly averages alongside monthly data |
💡 Tip: LOD_FIXED is the most commonly used type. Master it first before moving to INCLUDE or EXCLUDE.
3. Syntax
Every LOD formula follows this pattern:
LOD_FIXED(  AGGREGATION(measure),  dim1, dim2, ... )
LOD_INCLUDE( AGGREGATION(measure),  dim1, dim2, ... )
LOD_EXCLUDE( AGGREGATION(measure),  dim1, dim2, ... )
Golden rule: Aggregation always comes FIRST. Dimensions come AFTER.
| Part | Example | Meaning |
|---|---|---|
| Aggregation | SUM(sales) | What to compute |
| Dimensions | category, region | What to group by |
Examples:
LOD_FIXED(SUM(sales))                       → Grand total
LOD_FIXED(SUM(sales), category)             → Total per category
LOD_FIXED(SUM(sales), category, region)     → Total per category+region
LOD_INCLUDE(SUM(sales), customer_id)        → Add customer detail
LOD_EXCLUDE(SUM(sales), month)              → Remove month from view
💡 Tip: LOD formulas are case-insensitive and whitespace-tolerant.
lod_fixed(sum(sales))works fine.
4. Supported Aggregations
| Function | What It Does | Aliases |
|---|---|---|
| SUM(column) | Total | — |
| AVG(column) | Average | AVERAGE |
| COUNT(column) | Row count | �— |
| COUNT(Distinct column) | Distinct count | UNIQUE |
| MIN(column) | Smallest | — |
| MAX(column) | Largest | — |
| MEDIAN(column) | Middle value | — |
| STDDEV(column) | Standard deviation | STDEV, STDEVP |
| VARIANCE(column) | Variance | VAR, VARP |
5. LOD_FIXED — Lock Your Calculation
Computes at exactly the dimensions you specify, ignoring the chart's grouping. The most common LOD type.
Example 1: Grand Total (No Dimensions)
Goal: Show each category's sales alongside the grand total.
LOD_FIXED(SUM(sales))
No dimensions = compute across entire dataset. Same value on every row.
| Category | Sales | Grand Total |
|---|---|---|
| Electronics | 45,000 | 100,000 |
| Furniture | 32,000 | 100,000 |
| Clothing | 23,000 | 100,000 |
Example 2: Percentage of Total
Goal: Each category's % share of total sales.
SUM(sales) / LOD_FIXED(SUM(sales)) * 100
| Category | Sales | % of Total |
|---|---|---|
| Electronics | 45,000 | 45.0% |
| Furniture | 32,000 | 32.0% |
| Clothing | 23,000 | 23.0% |
Example 3: Percentage of Category
Chart: Category on X-axis, Region as color group.
SUM(sales) / LOD_FIXED(SUM(sales), category) * 100
| Category | Region | Sales | % of Category |
|---|---|---|---|
| Electronics | North | 18,000 | 40.0% |
| Electronics | South | 15,750 | 35.0% |
| Electronics | West | 11,250 | 25.0% |
| Furniture | North | 17,600 | 55.0% |
| Furniture | South | 14,400 | 45.0% |
Example 4: Per-Customer Lifetime Value
LOD_FIXED(SUM(order_value), customer_id)
Locks the computation to customer_id regardless of chart grouping.
Example 5: Comparing to a Benchmark
Goal: Difference from company-wide average.
AVG(sales) - LOD_FIXED(AVG(sales))
| Region | Avg Sales | Company Avg | Difference |
|---|---|---|---|
| North | 1,200 | 950 | +250 |
| South | 850 | 950 | -100 |
| West | 800 | 950 | -150 |
Example 6: Earliest Date Per Entity
LOD_FIXED(MIN(order_date), customer_id)    → First order date
LOD_FIXED(MAX(close_date), account_id)     → Latest close date
Multiple Dimensions & Date Bucketing
LOD_FIXED(SUM(sales), region, category)
LOD_FIXED(SUM(sales), DATE_TRUNC('month', order_date))
LOD_FIXED(SUM(sales), region, DATE_TRUNC('quarter', order_date))
6. LOD_INCLUDE — Add Extra Detail
Adds dimensions to the chart's grouping for this metric only. Result is finer-grained than the chart.
Example 7: Avg Sales Per Customer at Category Level
Chart: X-axis = Category. Goal: Average sales per customer, not per transaction.
AVG(LOD_INCLUDE(SUM(sales), customer_id))
Step 1: Inner LOD computes sales per category per customer (finer grain).
Step 2: Outer AVG averages those customer totals per category.
| Category | Avg Per Transaction | Avg Per Customer |
|---|---|---|
| Electronics | 150 | 380 |
| Furniture | 200 | 560 |
Example 8: Total Orders Per Customer, by Region
SUM(LOD_INCLUDE(COUNT(order_id), customer_id))
💡 Tip: When using LOD_INCLUDE, almost always wrap it in an outer aggregate like
AVG(...)orSUM(...).
7. LOD_EXCLUDE — Remove Detail
Removes a dimension from the chart's grouping for this metric only. Result is coarser-grained.
Example 9: Monthly Sales vs. Regional Average
Chart: X = Month, grouped by Region.
SUM(sales) - LOD_EXCLUDE(AVG(sales), month)
Computes average with month removed → region's overall average across all months.
| Region | Month | Monthly Sales | Regional Avg | Difference |
|---|---|---|---|---|
| North | Jan | 1,000 | 833 | +167 |
| North | Feb | 800 | 833 | -33 |
| North | Mar | 700 | 833 | -133 |
Example 10: Yearly Totals Alongside Monthly Detail
LOD_EXCLUDE(SUM(sales), month)
Same yearly total on every month row within a category.
⚠️ Warning: LOD_EXCLUDE requires at least one dimension.
LOD_EXCLUDE(SUM(sales))with no dimensions will error. UseLOD_FIXED(SUM(sales))for a grand total instead.
8. Combining LOD with Formulas
LOD works inside arithmetic, comparisons, date functions, and IF statements.
Z-Score Normalization
(SUM(sales) - LOD_FIXED(AVG(sales), category))
  / LOD_FIXED(STDDEV(sales), category)
Above / Below Average Flag
CASE
  WHEN SUM(sales) > LOD_FIXED(AVG(sales), region) THEN 'Above Average'
  ELSE 'Below Average'
END
Ratio to Group Total
SUM(revenue) / LOD_FIXED(SUM(revenue), region)
Date Arithmetic with LOD
DATEADD('day', 30, LOD_FIXED(MIN(order_date), customer_id))
DATEADD('month', 3, LOD_FIXED(MAX(close_date), account_id))
9. Multiple LODs in One Formula
(SUM(sales) - LOD_FIXED(AVG(sales))) / LOD_FIXED(STDDEV(sales))
Uses two LOD expressions — grand average and grand standard deviation.
Automatic Deduplication
If two metrics reference the same LOD, it's computed only once:
Metric 1: SUM(sales) / LOD_FIXED(SUM(sales)) * 100
Metric 2: SUM(revenue) / LOD_FIXED(SUM(sales)) * 100
                          ↑ Same LOD — computed once, shared by both. No performance cost.
10. Nested LOD — LOD Inside LOD
Place one LOD inside another for multi-step calculations.
Average of Customer Totals Per Region
LOD_FIXED(
    AVG(LOD_FIXED(SUM(sales), customer_id, region)),
    region
)
Inner: Total sales per customer within each region.
Outer: Average those totals per region.
11. Filter Behavior
One of the most important things to understand:
| LOD Type | Obeys Chart Filters? | Why |
|---|---|---|
| LOD_FIXED | No — ignores dimension filters | Stable reference that doesn't change when you filter |
| LOD_INCLUDE | Yes — respects filters | Modifies the view, follows view's filters |
| LOD_EXCLUDE | Yes — respects filters | Modifies the view, follows view's filters |
Example: Filter set to East region only:
LOD_FIXED(SUM(sales))                  → Total for ALL regions (filter ignored)
LOD_INCLUDE(SUM(sales), customer_id)   → Totals for East only (filter respected)
This is intentional. LOD_FIXED gives a stable reference value — essential for "% of total" where the denominator must be the full dataset.
12. Column Types
Number Columns (sales, revenue, quantity)
All aggregations work:
LOD_FIXED(SUM(sales), category)
LOD_FIXED(AVG(revenue), region)
LOD_FIXED(MEDIAN(profit), segment)
Date Columns (order_date, close_date)
Use MIN, MAX, COUNT, COUNTD only. NOT SUM, AVG, STDDEV.
LOD_FIXED(MIN(order_date), customer_id)    ✓ First order
LOD_FIXED(MAX(close_date), account_id)     ✓ Latest close
LOD_FIXED(SUM(order_date), customer_id)    ✗ INVALID
Text / Dimension Columns
LOD_FIXED(COUNT(Distinct customer_id), region)   ✓ Unique customers per region
LOD_FIXED(COUNT(product_name), category)          ✓ Product count per category
Dimension Types for Grouping Arguments
| Dimension Type | Example |
|---|---|
| Text / String | LOD_FIXED(SUM(sales), region) |
| Integer / Number | LOD_FIXED(SUM(sales), postal_code) |
| Boolean | LOD_FIXED(SUM(sales), is_returned) |
| Raw Date | LOD_FIXED(SUM(sales), order_date) |
| DATE_TRUNC | LOD_FIXED(SUM(sales), DATE_TRUNC('month', order_date)) |
| Expression | LOD_FIXED(SUM(sales), LEFT(product_name, 3)) |
13. Formula Columns with LOD
As the Measure
// profit_margin = revenue - cost
LOD_FIXED(SUM(profit_margin), category)
LOD_FIXED(AVG(profit_margin), region)
As the Dimension
// period = DATE_TRUNC('MONTH', created_at)
LOD_FIXED(SUM(sales), period)
LOD_INCLUDE(SUM(sales), period)
14. Common Business Formulas
% of Grand Total
SUM(sales) / LOD_FIXED(SUM(sales)) * 100
% of Group Total
SUM(sales) / LOD_FIXED(SUM(sales), category) * 100
Difference from Group Avg
SUM(sales) - LOD_FIXED(AVG(sales), region)
Customer Lifetime Value
LOD_FIXED(SUM(order_value), customer_id)
First Order Date
LOD_FIXED(MIN(order_date), customer_id)
Unique Customers/Region
LOD_FIXED(COUNT(Distinct customer_id), region)
Above/Below Avg Flag
CASE WHEN SUM(sales) > LOD_FIXED(AVG(sales)) THEN 'Above' ELSE 'Below' END
Avg Per Customer in Cat
AVG(LOD_INCLUDE(SUM(sales), customer_id))
15. What Is NOT Valid
✗ Dimensions before aggregation (wrong order)
LOD_FIXED(category, SUM(sales))
✗ No aggregation on the measure
LOD_FIXED(sales, region)
✗ Aggregation used as a dimension
LOD_FIXED(SUM(sales), MIN(close_date))
✗ LOD_EXCLUDE with no dimensions
LOD_EXCLUDE(SUM(sales))
✗ SUM / AVG / MEDIAN on date column
LOD_FIXED(SUM(order_date), customer_id)
16. Quick Reference Card
| What You Want | Formula |
|---|---|
| Grand total | LOD_FIXED(SUM(sales)) |
| Total per dimension | LOD_FIXED(SUM(sales), category) |
| % of grand total | SUM(sales) / LOD_FIXED(SUM(sales)) * 100 |
| % of category | SUM(sales) / LOD_FIXED(SUM(sales), category) * 100 |
| First order per customer | LOD_FIXED(MIN(order_date), customer_id) |
| Unique customers/region | LOD_FIXED(COUNT(DISTINCT customer_id), region) |
| Avg per customer in cat | AVG(LOD_INCLUDE(SUM(sales), customer_id)) |
| Customer lifetime value | LOD_FIXED(SUM(order_value), customer_id) |
17. Tips for Getting Started
1. Start simple
Test with LOD_FIXED(SUM(sales)) first. Get comfortable before building complex formulas.
2. LOD_FIXED is your best friend
Handles the vast majority of use cases. Learn it well first.
3. Understand filter behavior
LOD_FIXED ignores filters by design — giving you stable reference values. Use LOD_INCLUDE or LOD_EXCLUDE if you need filter-aware LOD.
4. Wrap LOD_INCLUDE in an outer aggregate
Use AVG(...) or SUM(...) around LOD_INCLUDE to aggregate back up to chart level.
5. No performance penalty for reuse
The same LOD in multiple formulas is computed once. Use it freely.
6. Dimensions must be column names
Not aggregated expressions. SUM(region) is not valid as a dimension.
7. Aggregation always first
LOD_FIXED(SUM(sales), category) ✓ — LOD_FIXED(category, SUM(sales)) ✗
Was this helpful?